By Pinar S. Ozbay
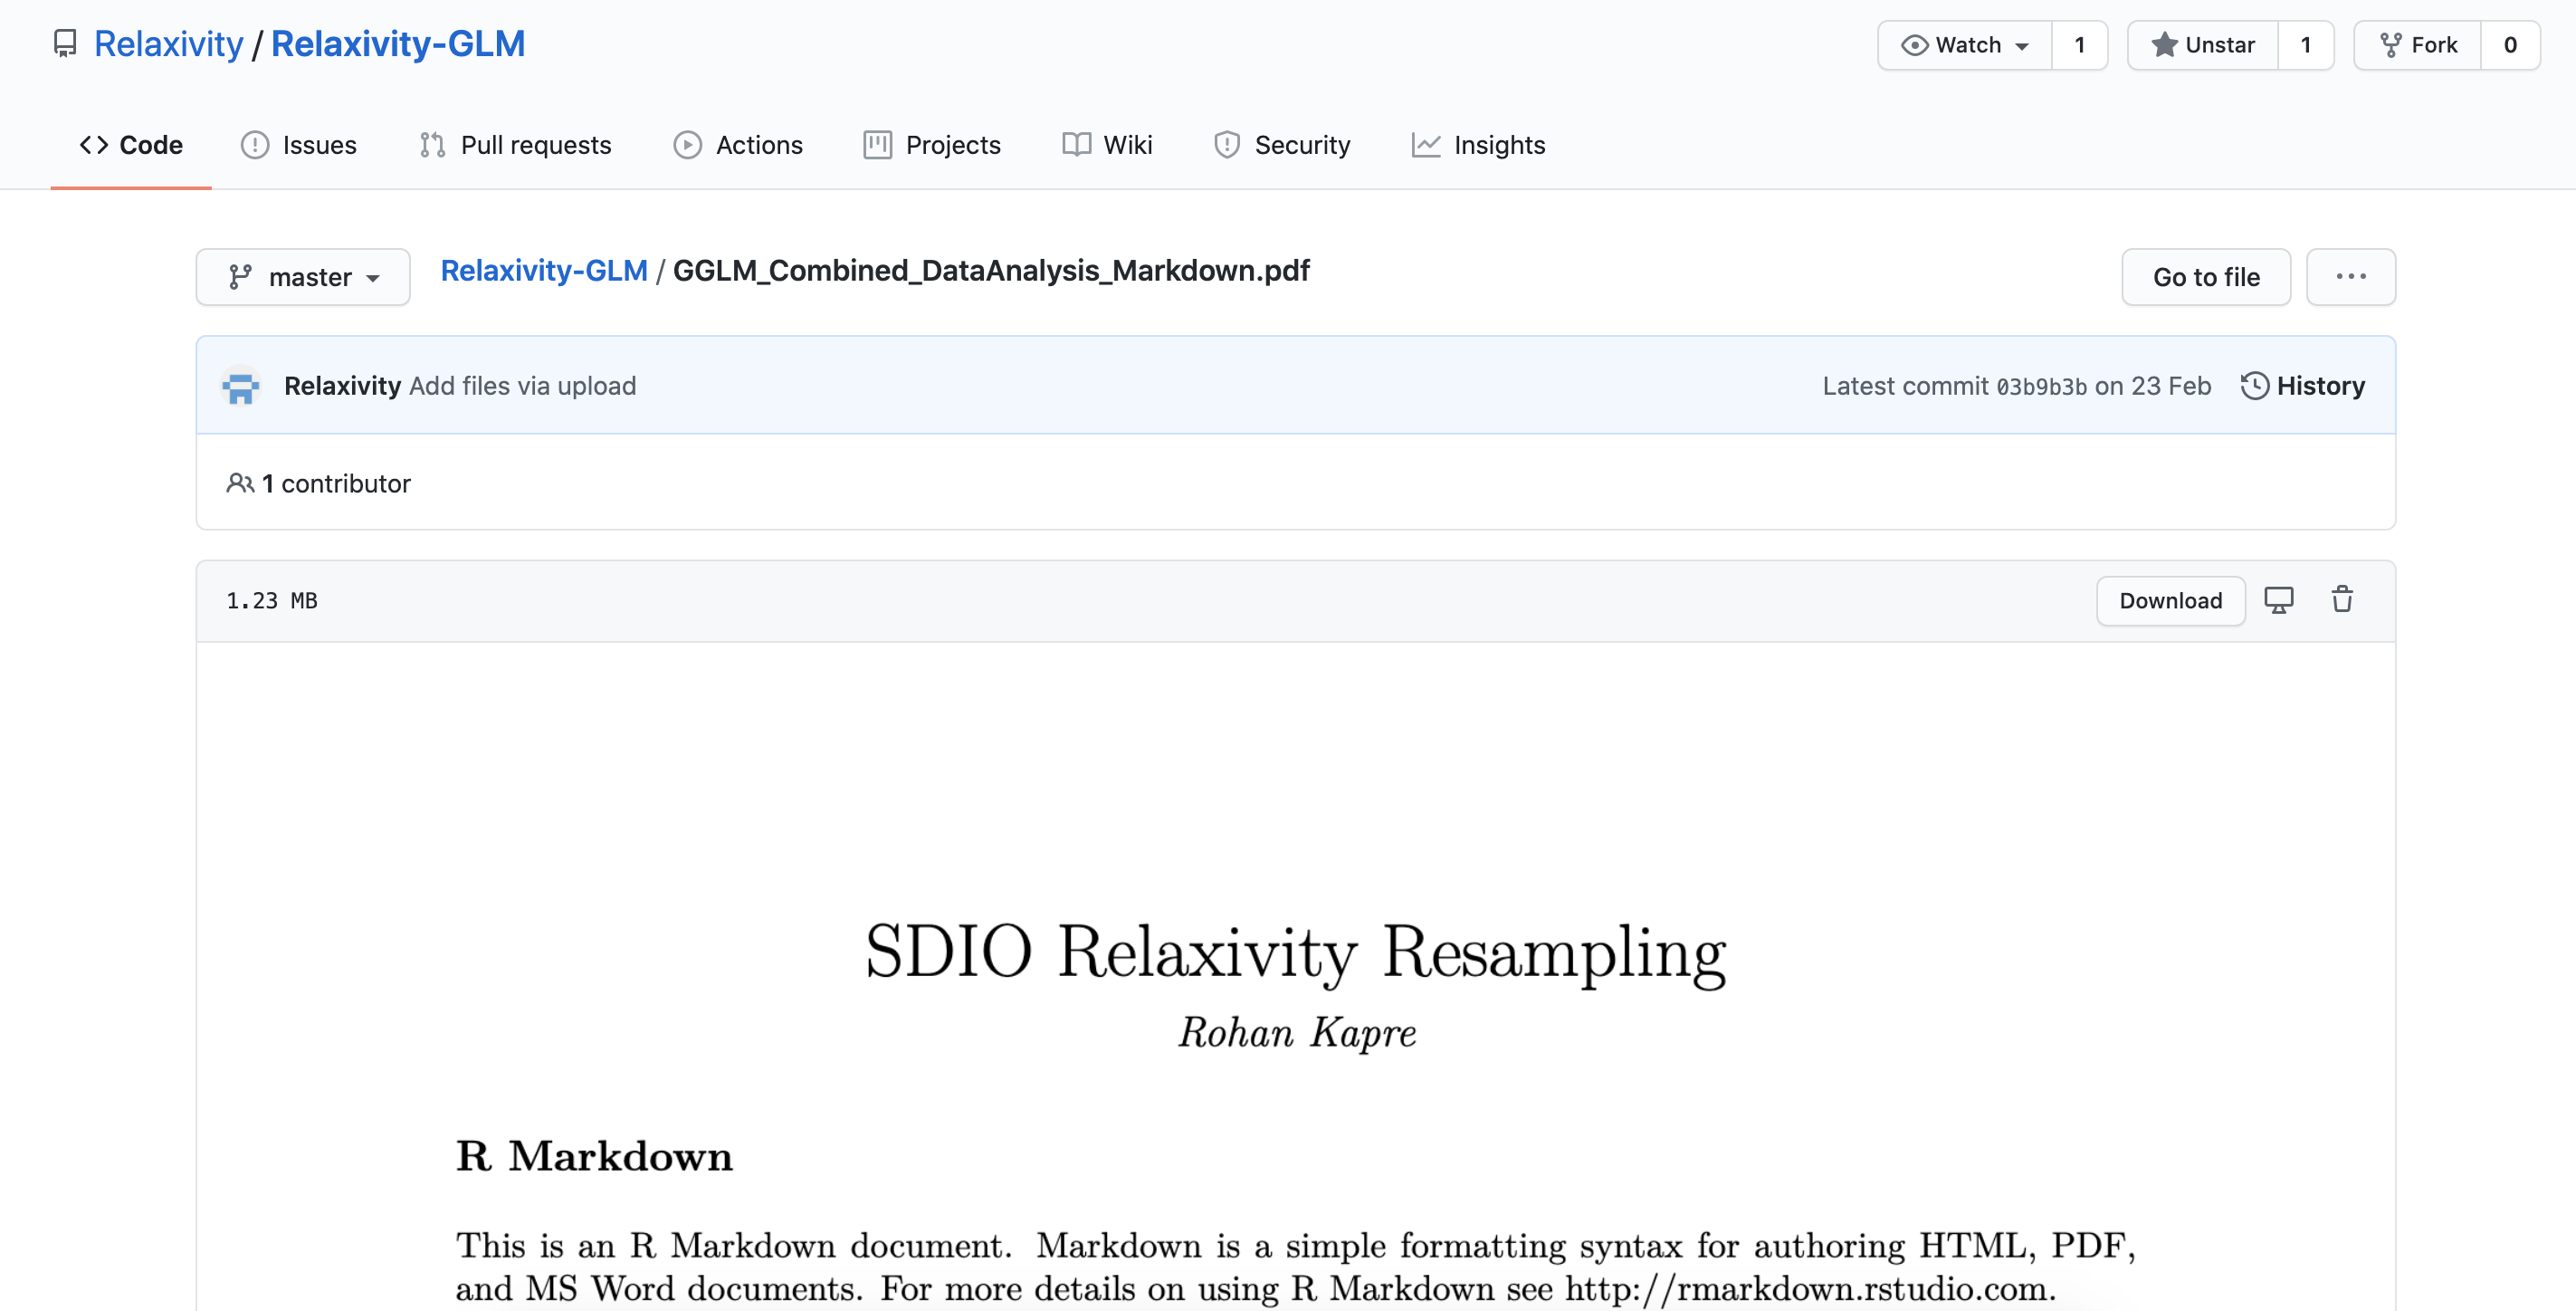
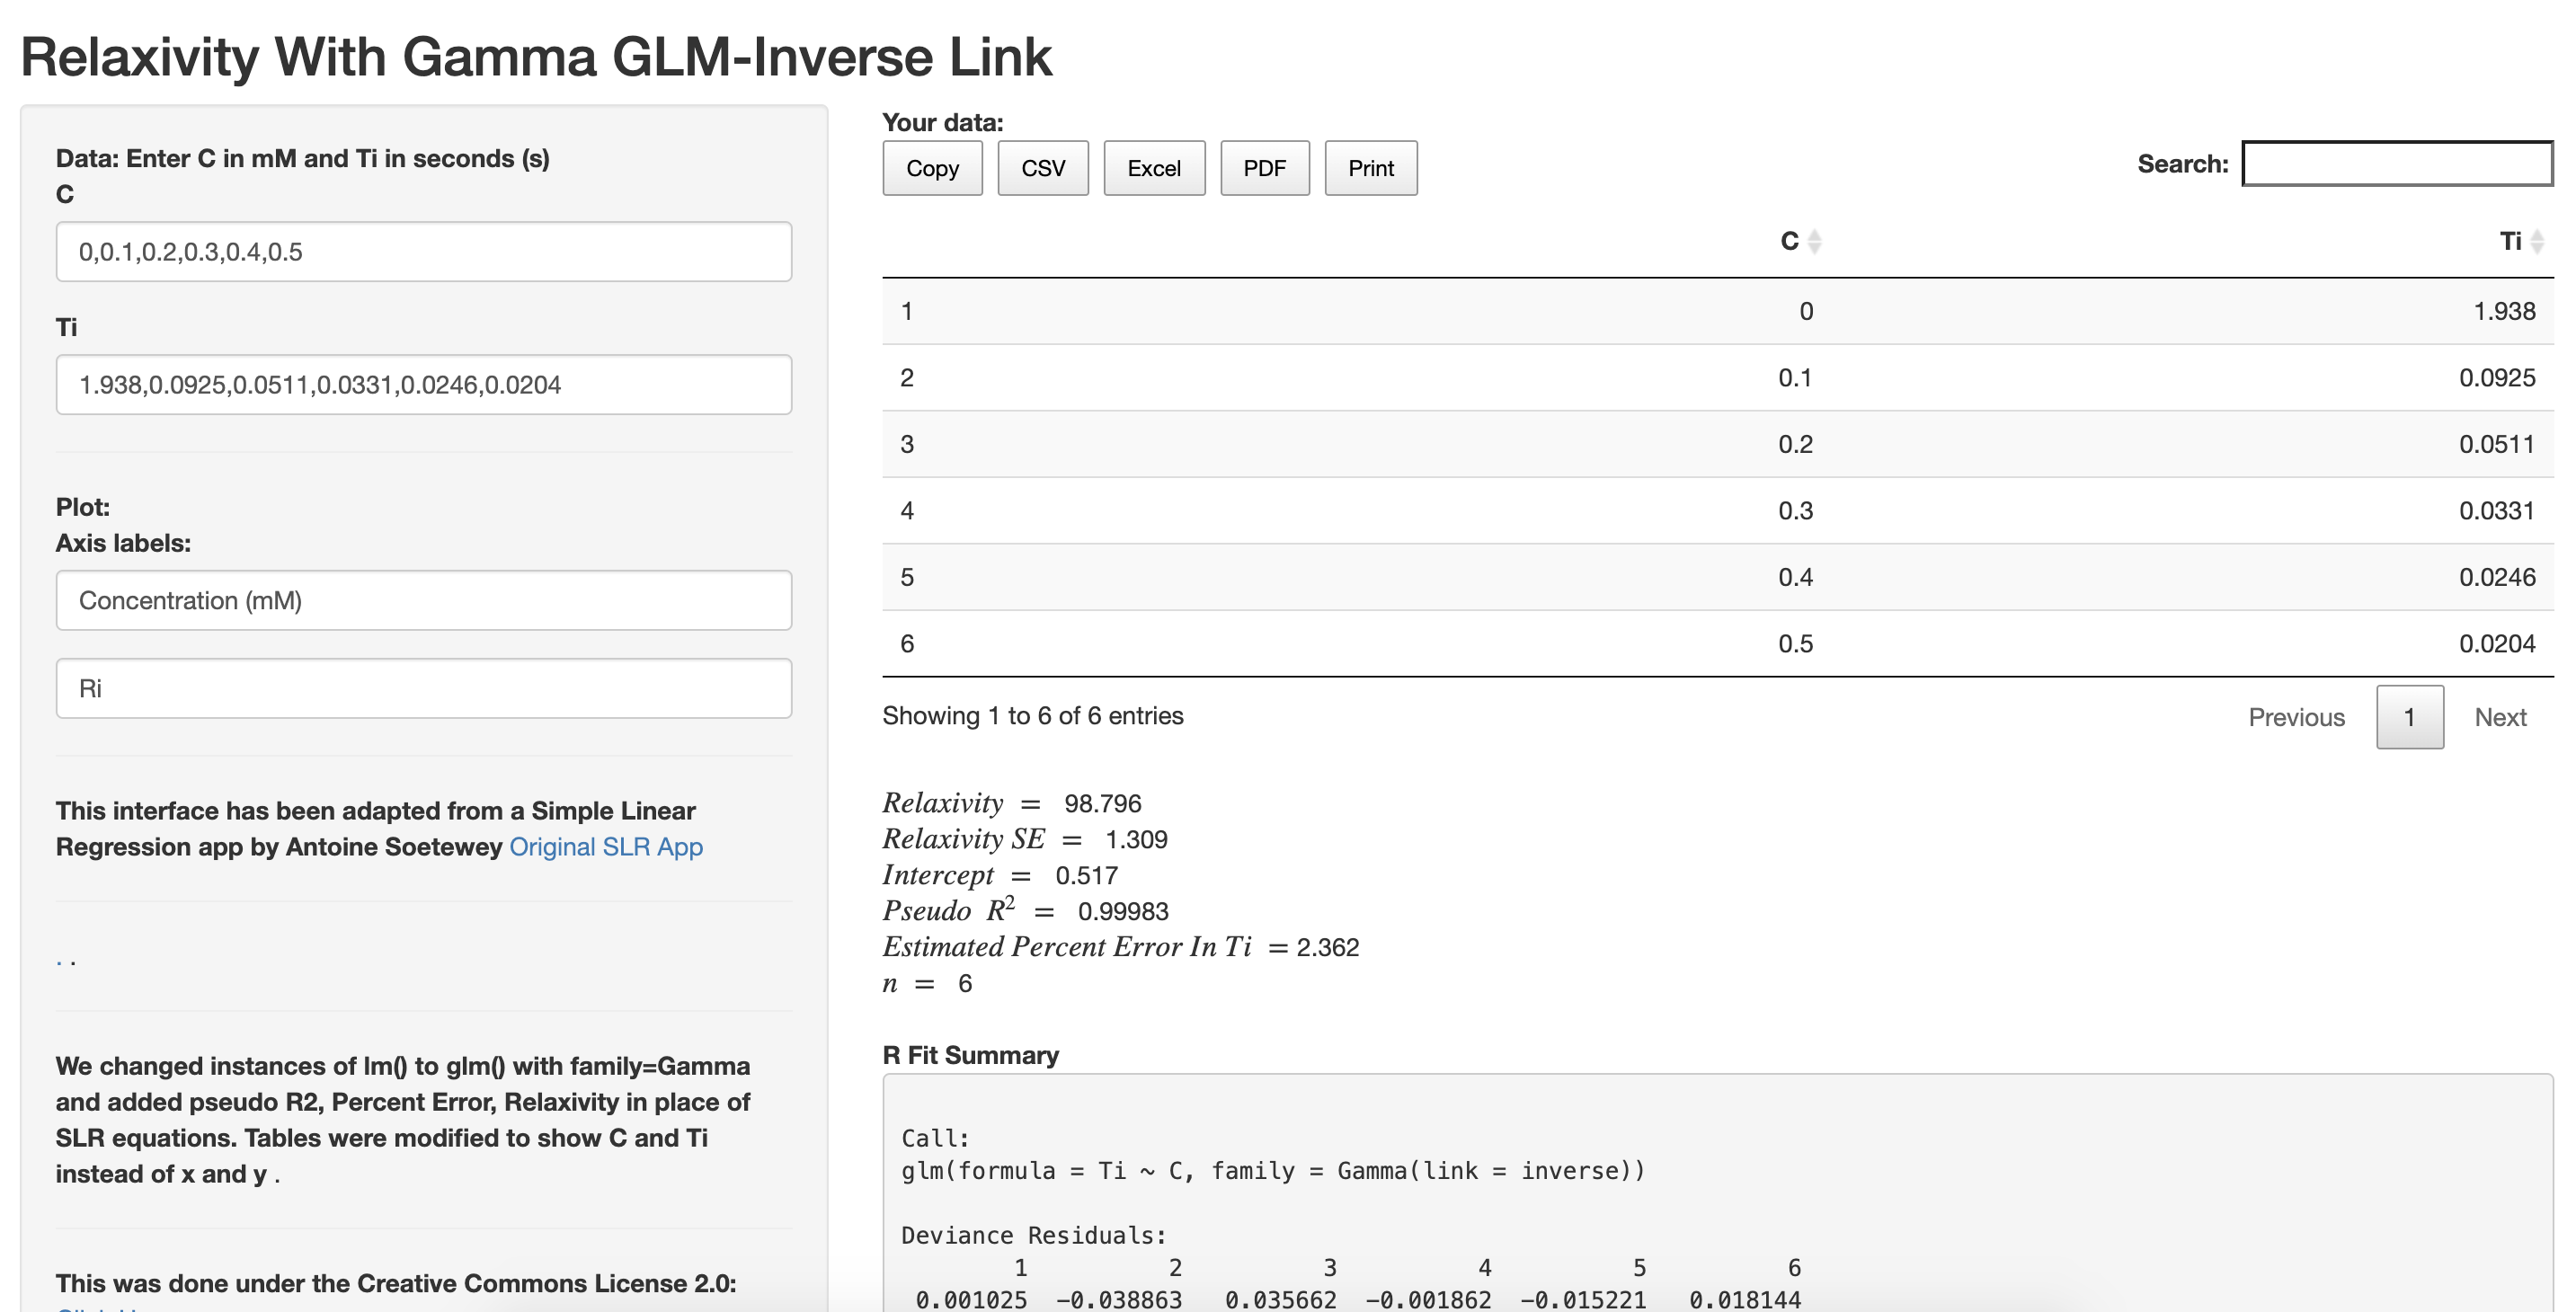
The July 2020 MRM Highlights Reproducible Research Insights interview is with Rohan Kapre and Angelique Louie, researchers at the University of California, Davis (UC Davis), and authors of a paper entitled “A novel gamma GLM approach to MRI relaxometry comparisons”. This paper was chosen as the MRM Highlights pick of the month because it reports good reproducible research practices. In particular, in addition to sharing code related to the paper in an R Markdown PDF document, the authors also created and shared an R Shiny dashboard to fit data on the web using their technique and displayed the data and fits using an interactive Plotly figure. For more information about Rohan and Angelique and their research, check out our recent interview with them.
General questions
1. Why did you choose to share your code/data?
We wanted to make the methods that we discussed in our paper accessible to everyone, and therefore to facilitate the adoption of our recommendations. The example in our R Markdown PDF of how we analyzed the R1 repeatability data from different facilities could serve as a guideline on how to perform ANOVA (technically, analysis of deviance for GLMs) and pairwise comparisons with Gamma GLM. This can be useful when comparing the effect of different contrast agents on R1/R2, although in that case the R function `emmeans()` should be used instead of `emtrends()` when comparing regression coefficients of categorical data, rather than continuous predictors like concentration in this work.
2. Do you plan to share code/data regularly in future publications?
Yes, it could be valuable to show how data from our papers was analyzed, in order to lend more transparency to the methods used in our field.
3. At what stage did you decide to share your code/data? Is there anything you wish you had known or done sooner?
The MRM Author Guidelines included a recommendation to make code available, and so, after our manuscript was accepted, that’s what we decided to do.
4. Are there any other reproducible research habits that you didn’t use for this paper but might be interested in trying in the future?
For data analysis papers, I think that in the future we will probably go on providing both the R Markdown document (or alternatives like Jupyter Notebooks) and the dataset.
Questions about the specific reproducible research habit
1. What motivated you to create an R Shiny interactive web interface for your work?
The dashboard was actually a suggestion from a labmate who came from a bio/chemistry background. Many in the MRI field are familiar with programming in languages such as R, MATLAB, and Python, all of which have GLMs. However, some relaxivity studies are done by researchers without a strong computational background, who may be familiar only with Microsoft Excel or Prism, which to our knowledge can only perform OLS regression. The R Shiny interface makes it easier for others to very easily apply the Gamma GLM (with inverse link) method and obtain valid coefficient/SE estimates immediately after performing the relaxivity experiment in the lab, without actually needing to open R or write code.
2. Can you share some resources to help our readers get started with using R Shiny?
The best tutorial is probably the one on their website. That said, the best advice we can give to beginners is to play around with R Shiny code that other people have developed in order to see how each of the pieces affects the overall dashboard. As you experiment with this, you can learn how to develop your own interface from scratch.
3. Did you come up against any challenges or hurdles working with R Shiny?
Yes, for us this was the first time ever using R Shiny and none of us have a CS/software background. Thus, at first, we only had an RStudio interface where the user still has to load the code, and it prompts them for the inputs. Luckily, we happened to find an existing R Shiny interface for Simple Linear Regression (linked in our dashboard) and modified it appropriately to suit the needs of relaxivity calculations performed using Gamma GLM-INV. Despite this, one issue we ran into was that we had a hard time using a non-default link function, specifically the identity link, and incorporating it into the app.
4. What advice do you have for people who would like to use R Shiny interfaces to share their research?
The great thing about the R Shiny community is that the code for many R Shiny interfaces is often shared and open-source. To get started, it could be a good idea to look for similar projects where R Shiny code is available. This will probably get easier as more people start using R Shiny within the MRI community.