By Mathieu Boudreau
This MRM Reproducible Research Insights interview is with Agah Karakuzu, a post-doctoral researcher at the NeuroPoly Lab at Polytechnique Montreal, who is the lead author of a paper entitled “Vendor-neutral sequences and fully transparent workflows improve inter-vendor reproducibility of quantitative MRI”. Agah’s article was chosen as this month’s Highlights pick because it demonstrated exemplary reproducible research practices; specifically, the authors shared open-source pulse sequences, Docker containers, BIDS-compliant data, and a beautiful interactive Jupyter Book. To learn more, check out our recent MRM Highlights Q&A interview with Agah and Nikola Stikov.
General questions
1. Why did you choose to share your code/data?
While standardizing acquisitions using vendor-neutral pulse sequences is an important step towards addressing the multi-center reproducibility problem, it only tackles a portion of the issue. To achieve comprehensive reproducibility, it is also necessary to establish a unified downstream processing pipeline. This is why, in our article, we emphasized the importance of sharing both the code and the data alongside our findings.
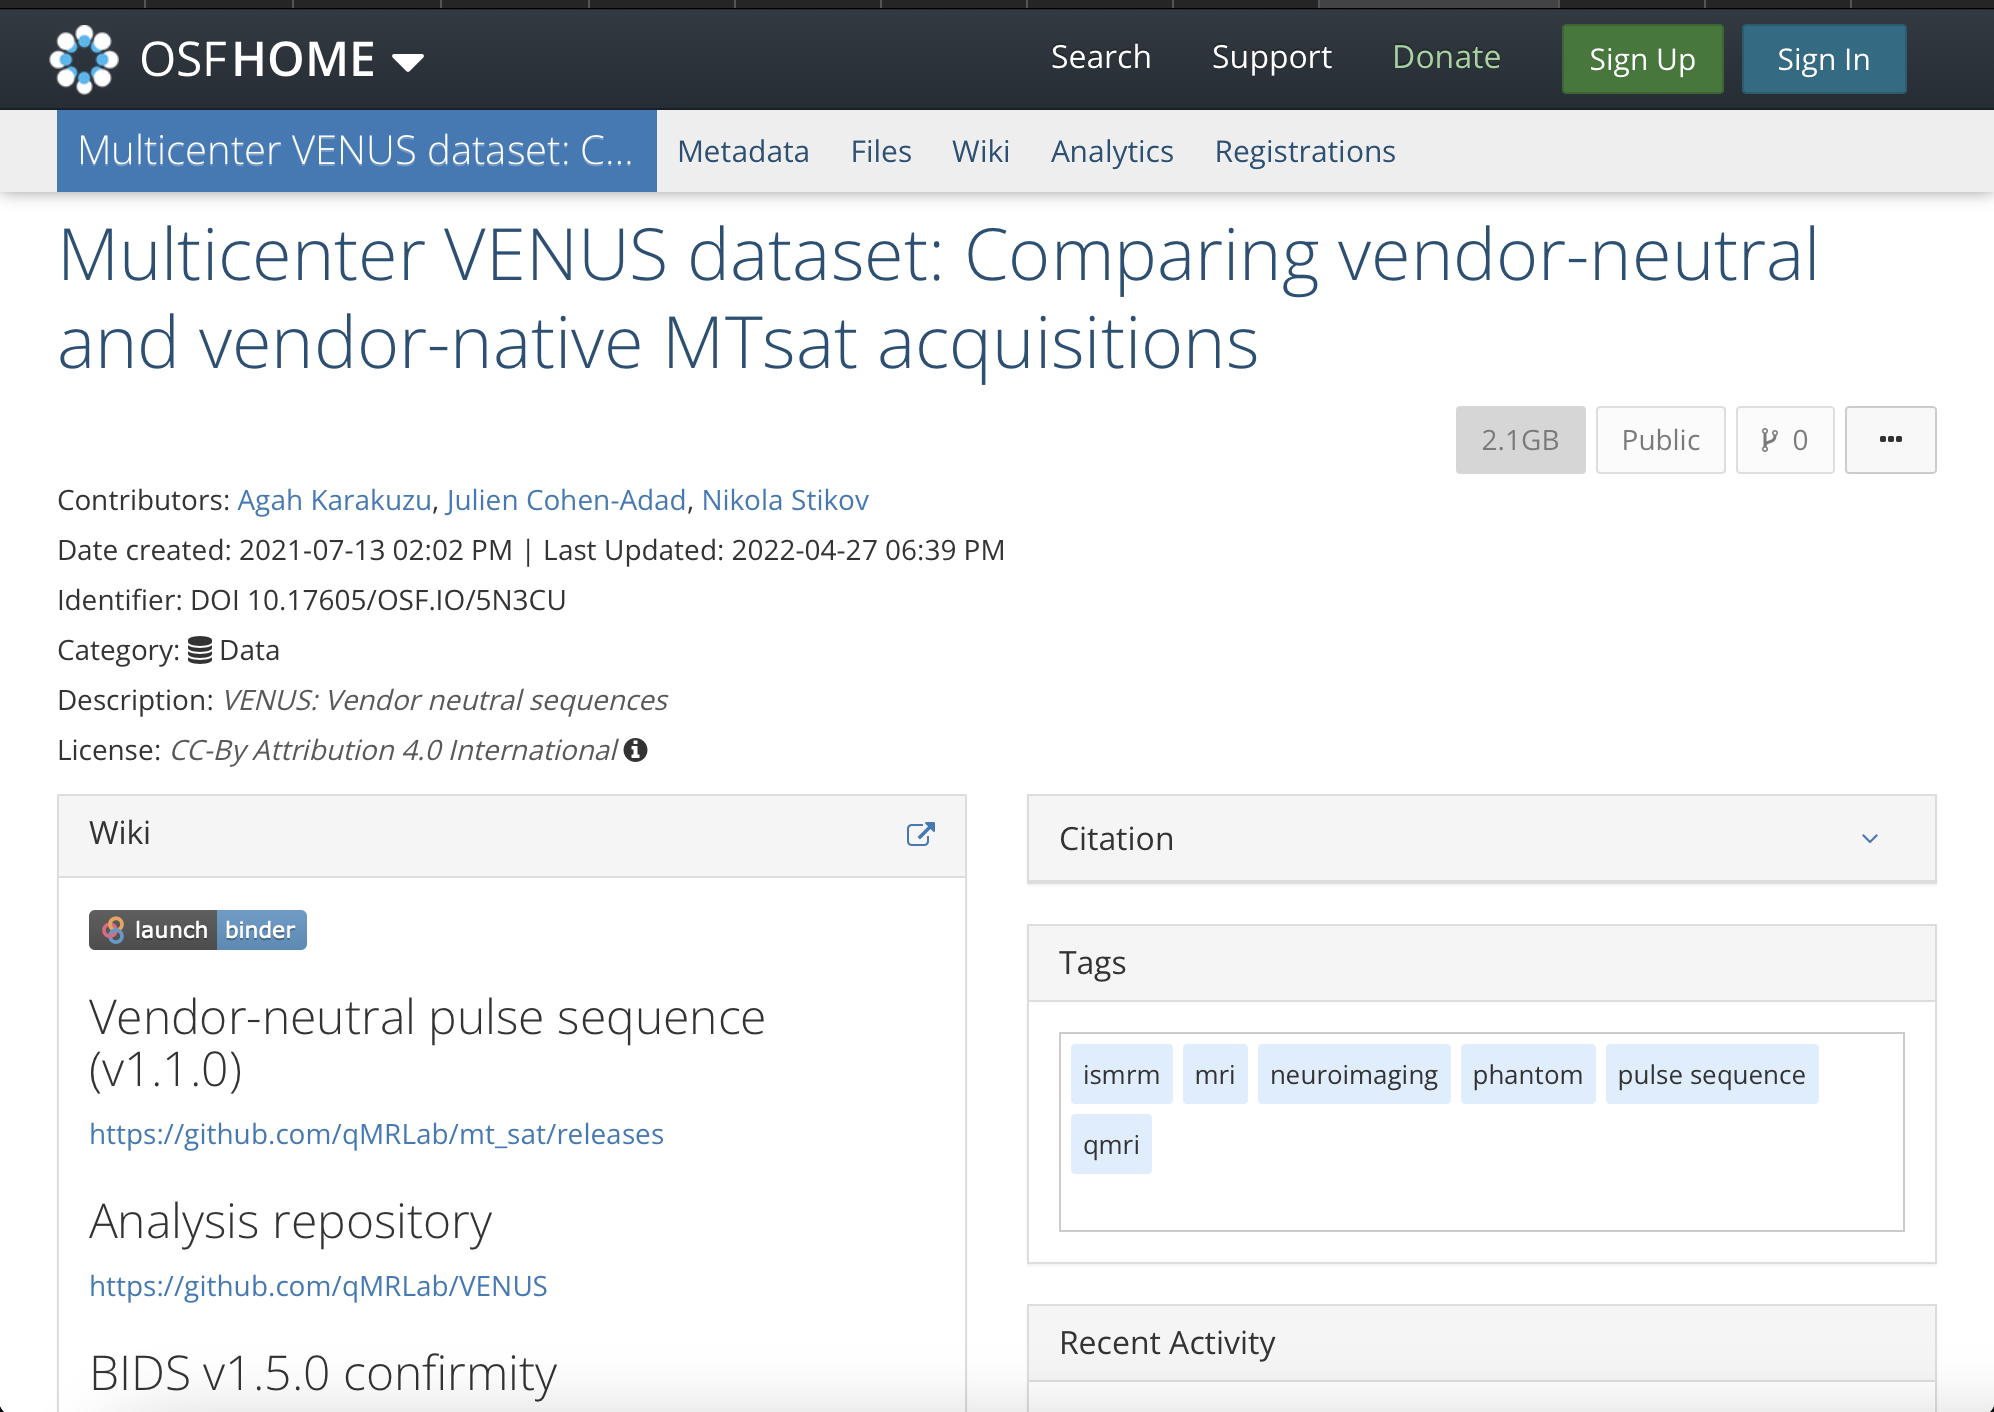
2. What is your lab or institutional policy on sharing research code and data?
At NeuroPoly, open-source is an important priority, and we strive to extend this beyond just developing software packages. As long as we have permission from the IRB, we make it our standard practice to share both code and data alongside our articles.
3. At what stage did you decide to share your code/data? Is there anything you wish you had known or done sooner?
This study is rooted in our commitment to sharing code and data from scanner to publication. This decision was made before we even began our work, and we have upheld this principle throughout the study. As we versioned these materials in their respective repositories, I believe there is nothing I wish we had done earlier in this context.
4. How do you think we might encourage researchers in the MRI community to contribute more open-source content along with their research papers?
An effective strategy could be to offer incentives to encourage researchers to contribute their work to MR-Pub. For example, they could be offered a discount on conference registration fees, free access to specific events or resources, or any other rewards designed to recognise the extra effort required to share their work. Over time, this could become a fundamental aspect of the publishing process, rather than an additional effort, and garner wider recognition as such.
Questions about the specific reproducible research habit
 1. What advice do you have for people who would like to develop and share open-source pulse sequences?
I strongly recommend prioritizing the creation of comprehensive documentation for the development process. The final version of a project may not reflect the challenges and issues that arose during its creation. While many of the solutions to such problems may not be relevant to an article’s content, documenting them can help other developers understand why certain implementation and setting choices were made. This can ultimately benefit the development community and promote more efficient and effective problem-solving in future projects.
2. Can you share some resources to help others get started using VENUS and RTHawk?
A good starting point would be https://qmrlab.org/VENUS, where users can find the necessary resources to test and simulate gradient/RF waveforms using SpinBench. However, for those interested in developing an RTHawk application, it is important to note that the software development kit is part of a proprietary product. Thus, guidelines for starting such development are only accessible to license owners.
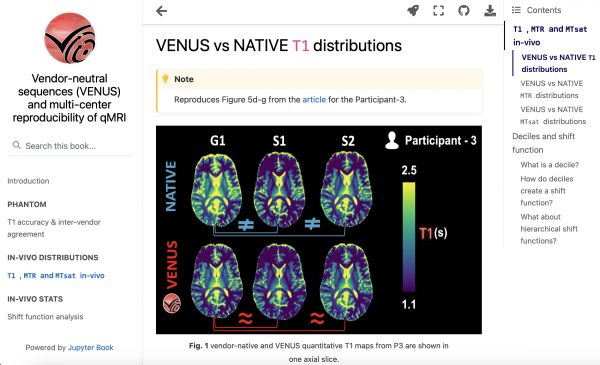
3. In addition to sharing your code and data, you created a website that contains interactive versions of your paper figures. Why did you put in the extra effort to do this, and are there resources available to help other researchers create similar content?
My primary goal is to move from papers that only include code to papers that are compiled from that code. While well-organized code and data are critical, runtime dependencies can pose significant issues that hinder reproducibility. To overcome this obstacle, I decided to develop a Jupyter Book. The interactive figures on this website enable readers to access the most condensed version of the data, directly from the figures. This feature not only allows readers to explore data from various perspectives, but also facilitates future meta-analyses by enabling easy importing (and possibly modification) of relevant information.
4. Are there any other reproducible research habits that you didn’t use for this paper but might be interested in trying in the future?
While interactive figures provide a window into a specific aspect of the data, they offer only a snapshot. Developing a dashboard, on the other hand, allows a more panoramic view of the published research and can help to answer questions that the article may not have explicitly addressed. Moreover, each user interaction on a dashboard interface re-executes the functions that generate the output, enabling users to reproduce the analysis at each click. Additionally, dashboards can be made available with zero downtime. For an example of this, please see https://rrsg2020.dashboards.neurolibre.org.