By Mathieu Boudreau
The January 2020 MRM Highlights interview is with Zaki Ahmed and Ives Levesque, researchers at McGill University in Montreal, Canada, and authors of a paper entitled “Pharmacokinetic modeling of dynamic contrast‐enhanced MRI using a reference region and input function tail”. Their paper was chosen as the MRM Highlights pick of the month because it reports good reproducible research practices. In particular, beyond sharing their code, the authors shared scripts that reproduce every single figure from their paper (even the supplementary figures). We sent them a questionnaire in order to gather further insights into their reproducible research practices. For more information about them and their research, check out our recent interview with them.
General questions
- Could you share some details about your open source project with us?
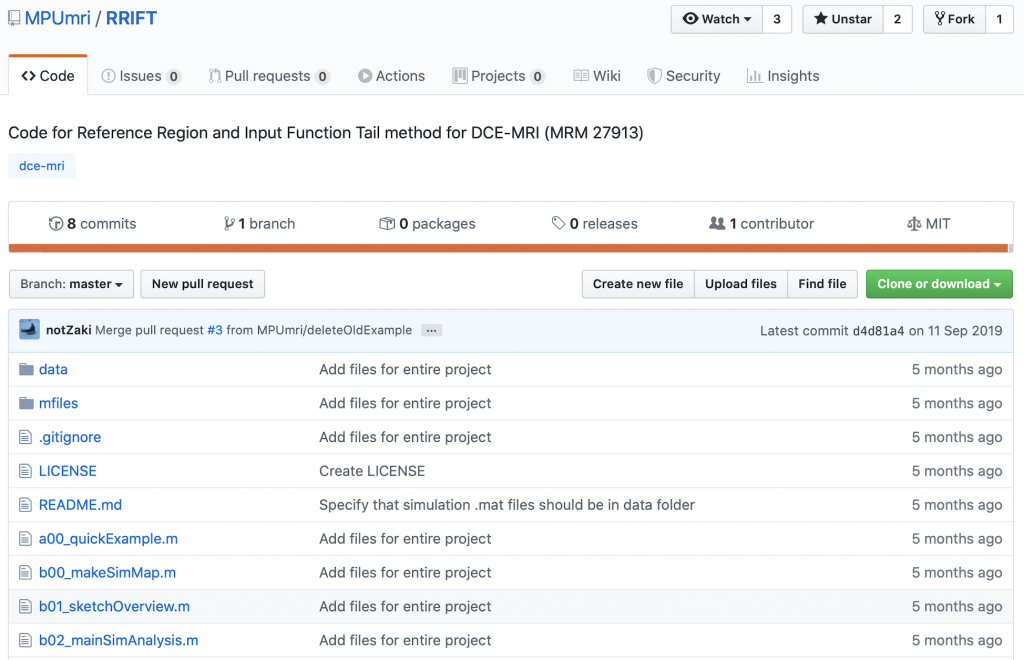
The shared code, which was hosted on GitHub and written in MATLAB, is everything that went into the publication, including the functions that implement the proposed method, the simulations, the in vivo evaluation, and the figures. There are no external dependencies, but it may require some MATLAB toolboxes. We are fortunate that our institution provides a license that grants full access to MATLAB’s toolboxes, so it’s not something we keep track of.
Another implementation of the code in Julia was also attempted to reproduce the work in a different language, with a focus on the in vivo evaluation. Although the general conclusion was reproduced, the exact correlation coefficients were different and we haven’t yet looked into the reason for those differences. The code in Julia has unit tests integrated with Travis-CI and Jupyter Notebooks in the `notebooks` branch, which are compatible with MyBinder.
2. Why did you choose to share your code/data?
It’s something we’ve done for all of our previous papers (see doi:10.1002/mrm.26530 and doi:10.1002/nbm.3924) and it just… makes sense? It’s the practice in our lab group to share code that accompanies a publication (see also doi:10.1002/mrm.26989). Our group is developing analysis techniques that are meant to be used, and offering code is one way of encouraging others to try them.
3. At what stage did you decide to share your code/data? Is there anything you wish you had known or done sooner?
We decided from the beginning of the project that the code would be shared. However, the code itself was developed in private. A small demo was made public when the paper was submitted, intended for the referees.The complete code was released after publication.

Zaki: I wish I had mentioned the code availability in the supplementary materials. In the paper, I mentioned the code availability in the Methods section, but this section is under a paywall. The supplementary materials are usually open to everyone, so mentioning the code repository there might have given it more visibility. Ideally, it would be nice if there was a dedicated area on the article’s page for links to shared code/data, when applicable.
I also wish I had known about unit testing sooner. MATLAB has apparently had functionality for this for about 3 years or so, but I was only exposed to the concept when I explored other languages. I think framing the project’s workflow as a testing suite would’ve been useful.
4. Are there any other reproducible research habits that you haven’t used for this paper that you are interested in trying in the future?
Zaki: Not specifically habits, but there are tools I would like to try:
- Nextjournal: This is a Web-hosted notebook that is similar to MyBinder except with more computing resources, and in which it is also somewhat easier to embed data. However, it was online only (last time I checked) and I prefer working with things locally. These considerations also apply to Code Ocean.
- ObservableHQ: This is a Javascript-based notebook that runs natively in the browser rather than relying on hosted servers. The catch is that everything has to be re-written in Javascript. It could potentially be useful for projects that benefit from fancier visualization tools (e.g. D3.js), but our work is mostly fitting a line through points, and Jupyter Notebooks are fine for that.
Questions about the specific reproducible research habit
- What practical advice do you have for people who would like to write code that creates reproducible figures to be shared along with their paper?
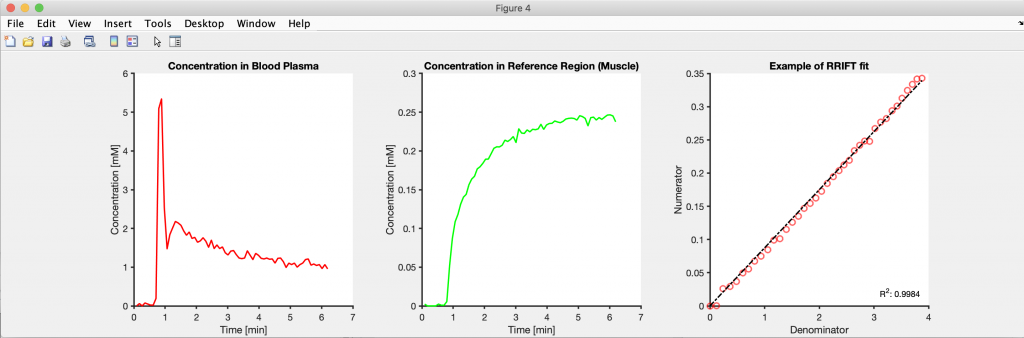
Create as much of the figure through code as possible. This includes adjusting the linewidths, colors, font sizes, labels, and legend position. Also, dissociate the project into smaller scripts/functions and save the intermediate results to disk. Creating figures is an iterative process, and if the code used for this purpose is its own function/script, then only that part has to be rerun to update a figure. If everything was in the same function/script, then changing a figure’s linewidth would require re-running the entire analysis pipeline.
2. Can you share some resources or insights that might help readers get started with sharing their code/data together with their paper?
“The Turing Way” is a recent project that does a good job of introducing the different ways of making research reproducible.
Since our work is mostly in developing code, it is helpful to be working with public data because that’s one less barrier. We are extremely grateful for the shared data repositories that are available to us such as the Cancer Imaging Archive (TCIA). Similarly, for projects where most of the work is in acquiring data, it may be useful to use public software packages/toolboxes for analysis (e.g. those on MR-Hub).
Learning about different technologies for reproducible workflows could be a bit overwhelming to newcomers so it’s probably better to focus on one aspect (e.g. git) and then extend from there.
3. Did you encounter any challenges or hurdles while developing the scripts/code that reproduce your figures?
Zaki: I had to learn about the different functions that MATLAB has for managing figures. Previously, I would generate a simple figure from MATLAB and then use a vector editing program—such as Inkscape or Affinity Designer—to spruce it up. However, this workflow requires manual steps, so I had to find a way of expressing those steps in code.
4. Other than it allowing you to give the MRI research community a useful gift, did you find any other benefits from developing code that reproduces your figures?
Zaki: I revisited the code and cleaned/re-factored it before making it public. This process made me see the inefficient habits in my code (and there are probably more that I missed). I think going through the code with a critical eye is useful for developing better coding practices, similar to how re-reading a paper and editing it leads to better writing skills.