By Mathieu Boudreau
The January 2021 MRM Highlights Reproducible Research Insights interview is with Martin Wilson, a researcher at the Centre for Human Brain Health and School of Psychology at the University of Birmingham, UK, and author of a paper entitled “Adaptive baseline fitting for 1H MR spectroscopy analysis”. This paper was chosen as the MRM Highlights pick of the month because it reports good reproducible research practices. In particular, Martin shared R code, thus making it possible to fully reproduce all the results reported in his paper. To learn more about Martin and his research, check out our recent interview with him.
To discuss this blog post, please visit our Discourse forum.
General questions
1. Why did you choose to share your code/data?
The primary reason was to make it as simple and transparent as possible for other researchers to reproduce and validate the method and findings for themselves. The MR spectroscopy analysis algorithm described in the paper (ABfit) is about 1000 lines of R code, and whilst it is possible to describe the salient aspects in a paper, there is no substitute for having access to the underlying code and data when attempting to reproduce non-trivial results.
Sharing the code also has a number of other important benefits:
- Other researchers can more easily apply ABfit to their own data, and this means that the paper has significant “added-value” compared with one that only describes the approach.
- Other researchers can suggest improvements or make modifications to the method to suit their particular use case.
- I, myself, am much more motivated to write higher quality code (providing more comments etc.) if I know there is a chance it will be read by others.
2. What is your lab or institutional policy on code/data sharing?
Most UK funders are promoting data sharing, in order to maximize impact and value for money, and consequently most institutions (including my own) are aware of its importance. My institution offers good educational support for learning the basic tools you need for writing and sharing code, in the form of software carpentry courses for R, Python, git and Linux.
Whilst the majority of researchers agree that data/code sharing is valuable, I don’t think the incentives are currently high enough to expect most researchers to routinely incorporate data and code sharing as an integral part of their research output. Researchers are already under great pressure to publish in journals with high impact factors, and it’s hard for them to justify the additional time they would need to spend on learning how to work in a reproducible fashion. I think greater incentives to share code and data would need to be incorporated into the way research quality is assessed in the UK (Research Excellence Framework) before we can expect any great shift in policy towards encouraging reproducible research practices.
3. At what stage did you decide to share your code/data? Is there anything you wish you had known or done sooner?
When I started working on a previous paper (MRM 2019 81(5):2878-2886) I decided I wanted to share all the code and data, and was pleased to see that MRM was encouraging this practice. Whilst it initially meant more effort, I ultimately prefer this way of working and so it was natural to use this approach for the ABfit paper too.
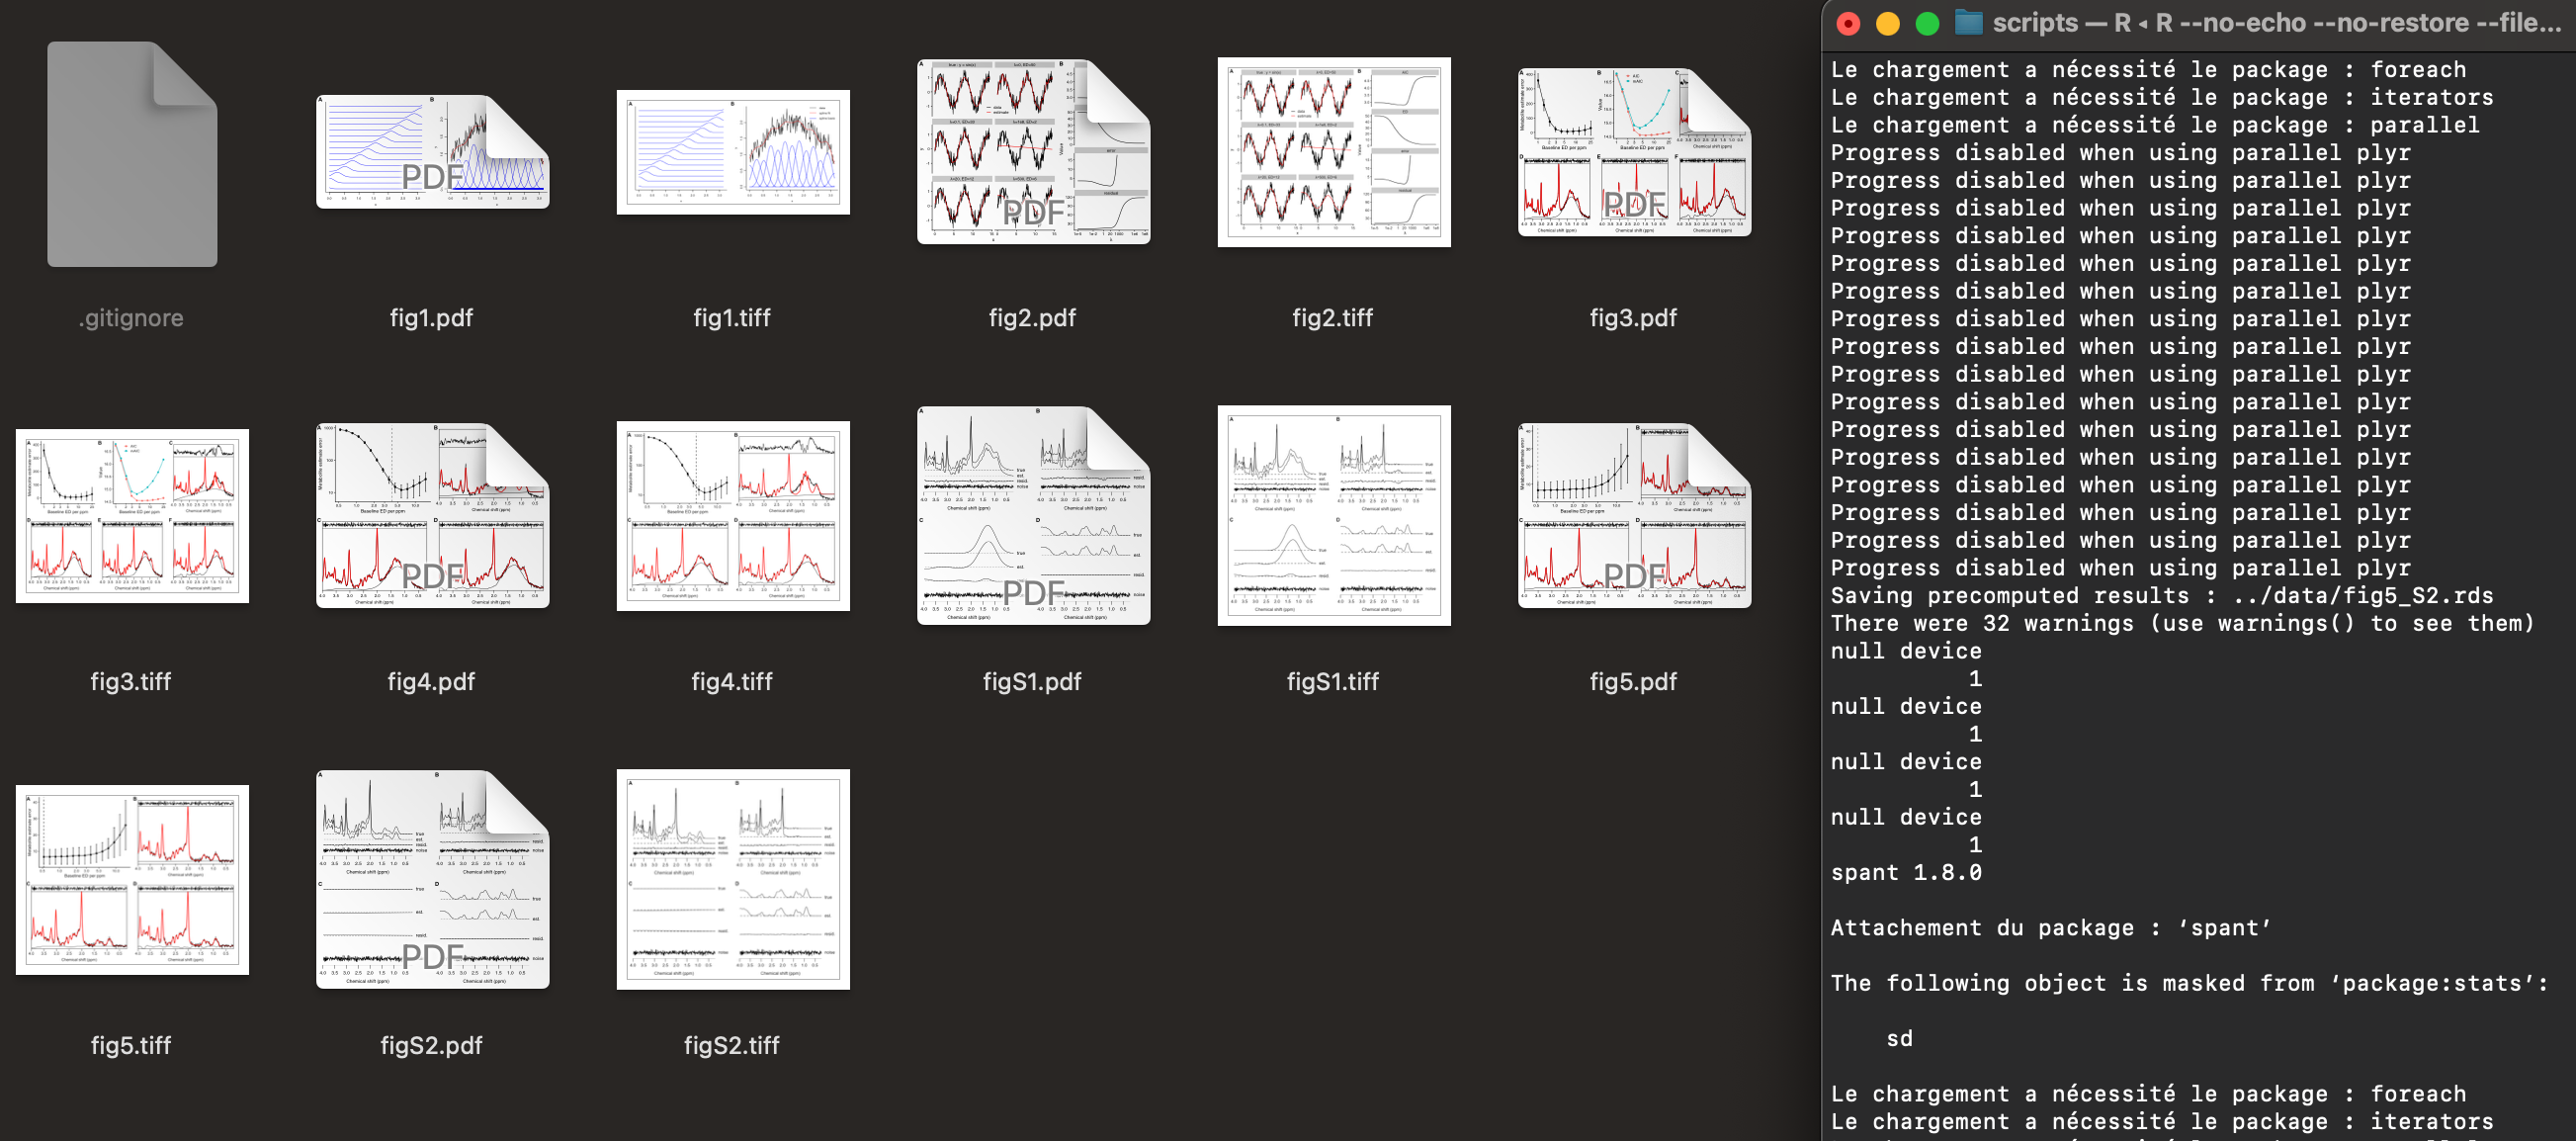
There is one particular aspect I’m hoping to improve in the future: I would like to develop a more consistent directory structure and more consistent file naming conventions for each paper. For instance, if someone wants to see how Figure 3 was generated, it should be really obvious where they can find the underlying code. Previous papers have been based primarily on simulated data, but in the future, I’m very interested in combining MRS with other modalities, and am looking forward to seeing how the Brain Imaging Data Structure (BIDS) can be used for data sharing.
4. How do you think we might encourage researchers in the MRI community to contribute more open-source code along with their research papers?
I suspect that papers that share code end up being cited more frequently. If this is indeed the case, we should be promoting the message that code sharing benefits your career as well as the wider research community. As journal reviewers and editors, we can also start to look more favorably on work where the code is shared.
Another important way of driving progress would be to develop a set of high-quality software packages that make coding complex MR processing and analysis pipelines easier and more transparent. I’m currently working on an R package (Spectroscopy Analysis Tools, spant), which incorporates the ABfit method, to aid reproducible MRS research by making it simple to perform standard analysis methods and generate figures.
Contributing to and supporting community resources promoting code sharing, such as the MRShub led by Georg Oeltzschner, is also a good way to encourage researchers thinking about adopting reproducible research practices.
Questions about the specific reproducible research habit
1. What practical advice do you have for people who would like to write code that creates reproducible figures to be shared along with their paper?
Think about all the steps that are required to get from your raw data to your figure and automate each one. Initially this can be challenging, as you might need to replace steps that you would normally perform using a GUI with code. Fortunately, most MR analysis software packages can be run on the command line or interface directly with programming languages like Python or R. You’ll also need to think carefully about how to organize your data so it can be processed not by manual point and clicking, but rather in an automated way by programmatically searching a directory structure. Reading about BIDS would be a good place to start if you have larger complex datasets. If you’re using Excel or SPSS to do the final stages of analysis, such as statistics or plotting, now is the time to replace those tools with code — I prefer to use R for this stage. Finally, write a master script that calls the other scripts to produce each figure, and write a README file to explain the important parts of the project directory structure.
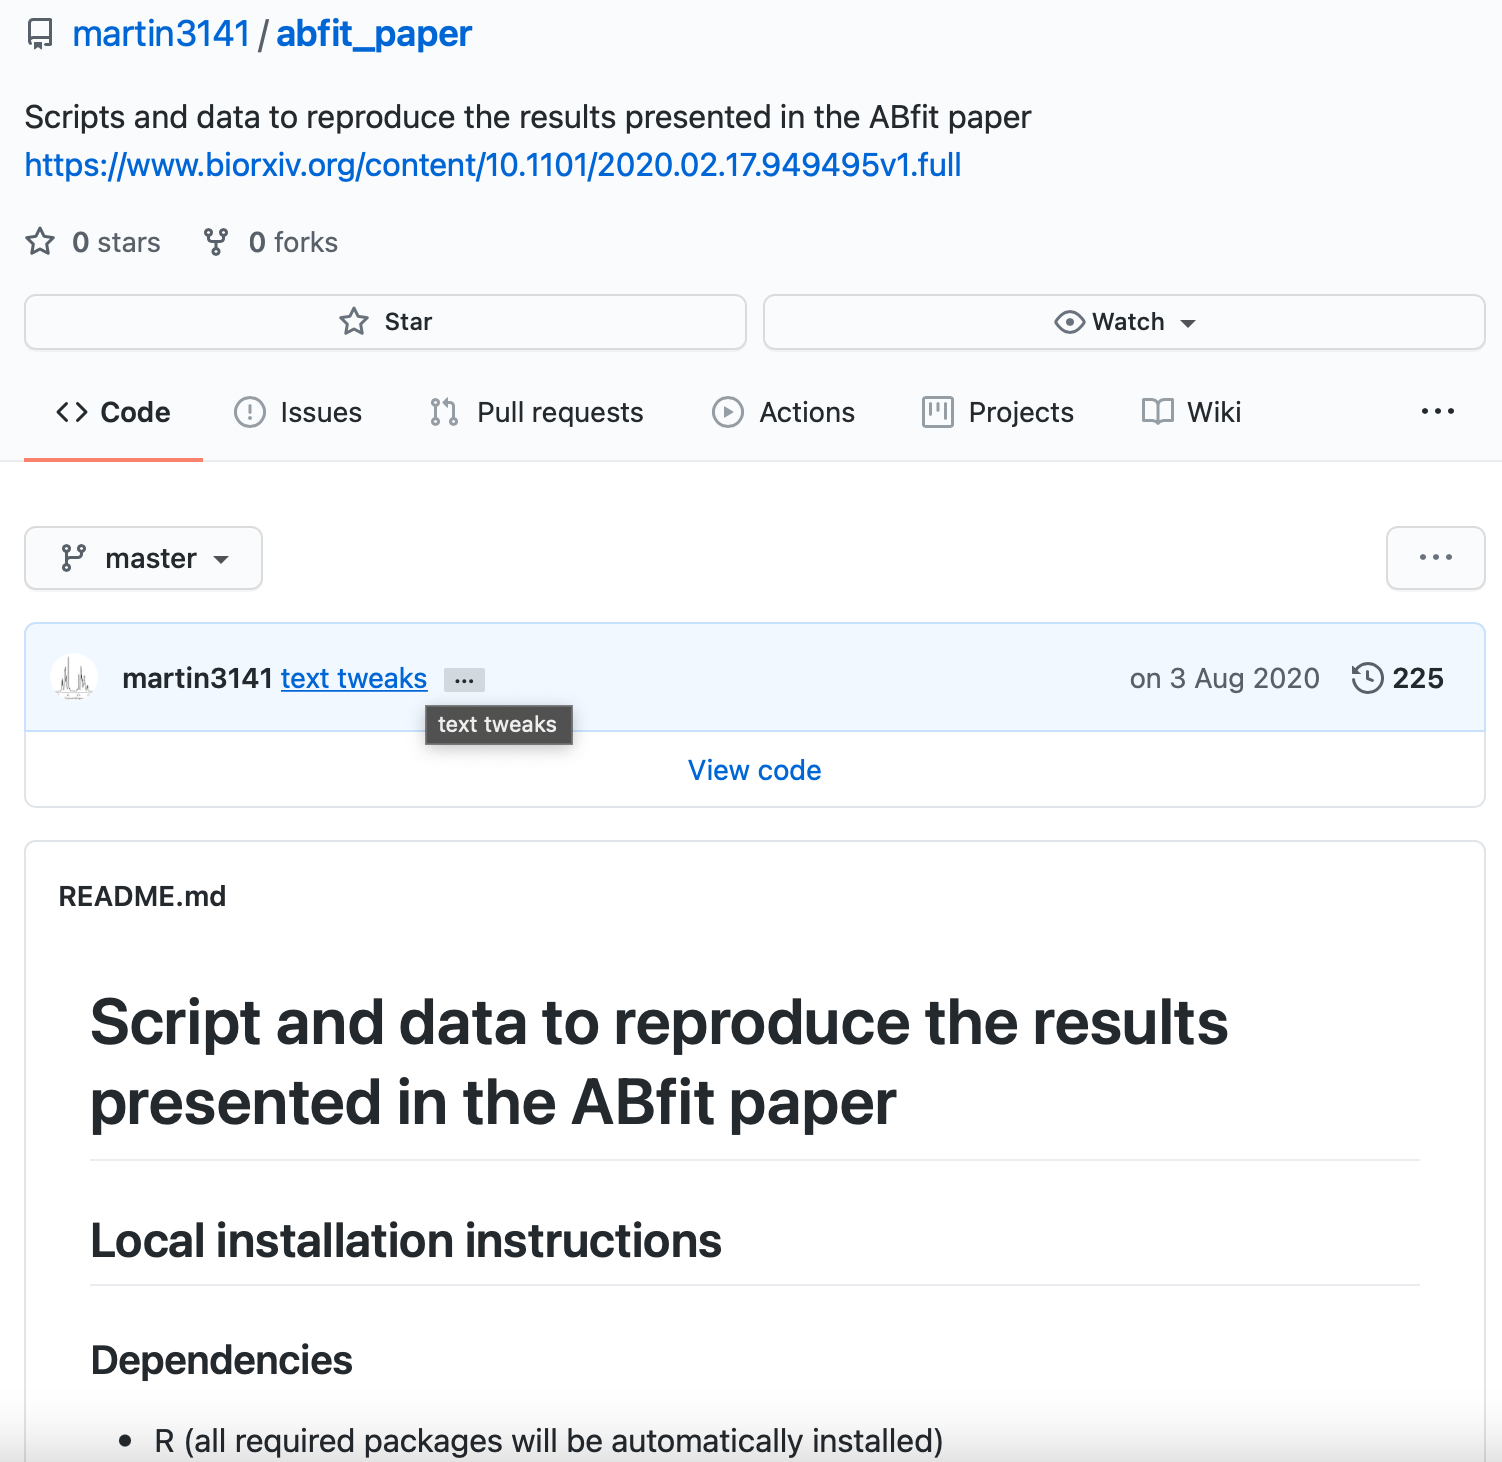
Once you’re comfortable with the above, learn how to use git and github/gitlab to make it easier to share your code, track changes and experiment with alternate analyses using git branches.
2. Did you encounter any challenges or hurdles while developing the scripts/code that reproduce your figures?
I’ve previously had problems with figures saved in eps format rendering poorly in the online submission portal. I now export figures as high-resolution tiff images to avoid inconsistencies between PostScript interpreters.

3. Why did you choose R as the programming language for this project?
I’ve used MATLAB, Python, C++ and R for MRS analysis over the years and, for my purposes, R is the best tool available for the job right now. R is free open-source and easy to install, so if I want to get a collaborator up and running with the software quickly, there are no issues with costs, license management or toolboxes like you have with MATLAB. Python is an excellent language that has exploded in popularity in recent years, however in my experience, getting Python software with many dependencies to work reliably can be challenging for users with limited programming experience. One of the big strengths of R is the ease of developing, distributing and installing packages via the Comprehensive R Archive Network (CRAN). On the development side, I’ve found RStudio to be superb software for coding, debugging and interactive analysis.
The main areas where Python has the edge over R are probably deep learning applications and development of desktop GUIs. Fortunately, there is a trend toward greater interoperability between Python and R, so in the future I think we can look forward to easily getting the best of both worlds.
4. You also chose to share reviewer comments on your manuscript in your GitHub repository. What prompted you to do this?
Once you’re in the habit of working on the code, data and manuscript text as part of a git repository, it makes a lot of sense to put the reviewer comments and author responses in there too. That way, if I’m swapping between my laptop and desktop PC, I can always be sure I have the most up-to-date version of everything, and also have the peace of mind that everything is synchronized and backed up. In addition, the reviewers’ comments often make an important contribution to the manuscript, so I think it makes sense to have them accompanying the rest of the work.
5. Are there any other reproducible research habits that you haven’t used for this paper but might be interested in trying in the future?
My main goal for the future, in terms of working reproducibly, is to identify the best ways to share MRS data alongside other modalities. There are many data formats for MRS, most of which are proprietary, and that is a significant barrier for effective MRS data sharing. I’m part of a team, led by Will Clarke, working on a new format for storing MRS data based on NIfTI. So far 8 MRS analysis software packages have agreed to support the format, and we are currently looking for wider feedback on the draft specification. We also have a software tool spec2nii for converting from vendor formats to NIfTI MRS and the hope is that this will become the standard tool and format for MRS data sharing. Once we have a standard storage format agreed, an extension to the BIDS specification to incorporate MRS data sharing alongside other modalities will be the next step.